Crime Data Graphic
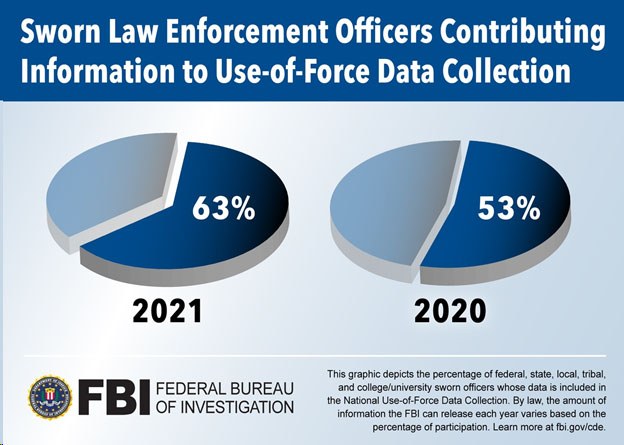
This graphic depicts the percentages of federal, state, local, tribal, and college/university sworn officers whose data is included in the National Use-of-Force Data Collection. Learn more at fbi.gov/cde. (2020 - 53% and 2021 - 63%)
https://leb.fbi.gov/image-repository/crime-data-graphic.jpg/view
https://leb.fbi.gov/image-repository/crime-data-graphic.jpg/@@images/image
Crime Data Graphic
This graphic depicts the percentages of federal, state, local, tribal, and college/university sworn officers whose data is included in the National Use-of-Force Data Collection. Learn more at fbi.gov/cde. (2020 - 53% and 2021 - 63%)

