
Active Shooter Events from 2000 to 2012
By J. Pete Blair, Ph.D., M. Hunter Martaindale, M.S., and Terry Nichols, M.S.
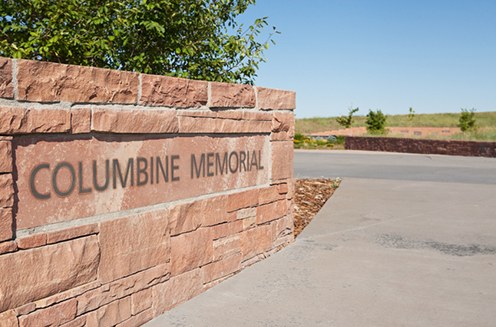
On April 20, 1999, two Columbine High School students killed twelve classmates and a teacher in Littleton, Colorado. The shooters committed suicide before officers entered the school to intervene. Outrage on the part of the public and deep introspection by the police produced massive changes in law enforcement response to ongoing acts of violence.1 Unfortunately, active shooter events (ASEs) have continued to occur. Recent tragedies have happened at the Century 21 Movie Theater in Aurora, Colorado, and Sandy Hook Elementary School in Newtown, Connecticut. Out of 70 people shot in Aurora, Colorado, 12 eventually died. Twenty first graders, six staff members, and the shooter’s mother were murdered in Newtown. Even more recently, employees at the Washington Navy Yard in the District of Columbia were attacked. Twelve people were killed in this attack. All four of these events drew national attention.
Such high-profile events put a substantial amount of pressure on law enforcement officials to respond effectively; however, solid empirical information is needed if law enforcement administrators are to develop effective policies and procedures regarding these events. The goal of this article is to provide such information along with the authors’ insights into what these data tell us about an effective active shooter response.
Although not an exhaustive review of each incident, this evaluation identified a steady rise in incidents, as well as a consistent increase in the number of those shot and killed. The data establish that officers must have the equipment with them to engage the shooter to end the threat and must be prepared to administer medical assistance to the wounded before emergency medical services (EMS) arrive.
In addition, though officers responded quickly (i.e., median time three minutes), shooters inflicted devastating damage beforehand. This adds to the growing evidence that citizens must have insight on how to respond. The FBI’s support for strong citizen awareness, detailed in the “Run, Hide, Fight” protocol, is endorsed by all other federal agencies.2 The data establish that when prepared, the potential victims themselves can stop the shooter.
Dr. Blair is the director of research for the Advanced Law Enforcement Rapid Response Training Center and an associate professor of criminal justice at Texas State University, San Marcos.
Mr. Martaindale is a research assistant for the Advanced Law Enforcement Rapid Response Training Center and a graduate student at the Texas State University School of Criminal Justice in San Marcos.
Mr. Nichols retired as a commander from the San Marcos, Texas, Police Department and is the assistant director of the Advanced Law Enforcement Rapid Response Training Center.
METHODOLOGY
Search Strategy
The federal government defines an active shooter as “an individual actively engaged in killing or attempting to kill people in a confined and populated area, typically through the use of firearms.”3 For this study ASEs were located via a systematic search strategy.4 Public records were searched using a variety of search terms to locate news stories from 2000 to 2012 involving potential ASEs in the United States. Incidents identified from these searches then were evaluated to see if they met the following criteria: The event had to involve one or more persons engaged in killing or attempting to kill multiple people in an area occupied by multiple unrelated individuals—at least one of the victims must be unrelated to the shooter. The primary motive in these incidents appears to be mass murder; that is, the shooting is not a by-product of an attempt to commit another crime. While many gang-related shootings could fall within this category, they were excluded from this study because gang-related shootings are not considered ASEs by law enforcement. A total of 110 active shooter events were identified through this process.
To check the completeness of the list, the authors checked the events identified during the search process against other lists/collections of ASEs. In no case did the authors find an event (that met their definition) in another list that they had not found via the public records search. While the authors believe that the search strategy produced an accurate list of ASEs, it, of course, is possible that they missed an event.
Data
Sources used to collect information about the events included reports from the investigating agencies, the supplemental homicide reports (SHRs) produced by the FBI, and news stories. Not all sources of data were available for all events. The most current data from SHRs only cover up to 2010. For this reason it was not possible to use SHRs for events that occurred in 2011 and 2012. Recent events generally are under ongoing investigations, and the investigating agencies do not release these reports. Therefore, events that occurred during 2011 and 2012 were coded from the most recent news reports.
For the events that occurred between 2000 and 2010, agency reports were obtained through Freedom of Information Act (FOIA) requests. Out of these 84 events identified between 2000 and 2010, 42 agencies (50 percent) supplied the requested information. Forty-six of the 84 events (55 percent) were located in the SHRs. News reports were available for all 110 events. When data were available from multiple sources, the agreement between the sources was high. Two coders also coded the events to ensure reliability. Their agreement with each other was high.
FINDINGS
A discussion will cover the increasing frequency of ASEs and the number of people killed. Next, information about the shooters will be presented. Finally, how the events concluded will be described.
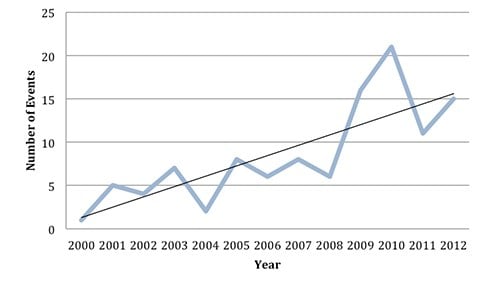
Figure 1. Active Shooter Events by Year
Characteristics of Events
Frequency
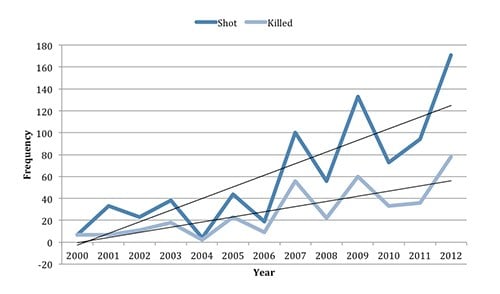
Figure 1 presents the frequency of ASEs by year. The dotted trendline shows a definite increase over the past 12 years. In fact, the number of events drastically increased following 2008. The rate at which these events occurred went from approximately one every other month between 2000 and 2008 (5 per year) to more than one per month between 2009 and 2012 (almost 16 per year). The authors’ tracking also indicates that this increased rate has continued into 2013—more specifically, there were 15 events. While it is possible that this increase is an artifact of the search strategy (perhaps, archiving of the news reports has improved in recent years), the authors believe that the observed rise represents a real increase in the number of events in recent years. Figure 2 shows the number of people shot and the number of people killed for each year. Here again the trend line shows a definite increase. The authors’ tracking indicated that there were 72 people shot and 39 killed in 2013.
Figure 2. Number of People Shot and Killed Per Year
Location
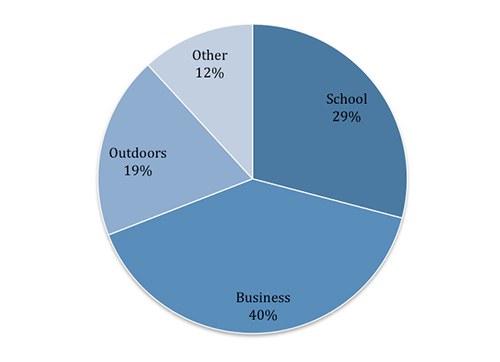
Figure 3 illustrates the primary location of ASEs. Business locales (e.g., retail stores, office buildings, and factories/warehouses) were the most frequently attacked locations. Schools, both K-12 and institutions of higher education, were the second-most attacked locations at 29 percent. Approximately 1 out of 5 ASEs occurred in outdoor environments. The other category includes places, like military bases and churches, that did not fit into one of the other categories. It also is worthwhile to note that 18 percent of the attackers went mobile during their attacks; that is, the perpetrator started at one location and then moved to another while still actively attacking. Most frequently, attackers simply walked to another nearby location, but in some cases they used an automobile to move between more distant attack sites.
Figure 3. Location of Attacks
Police Response Time
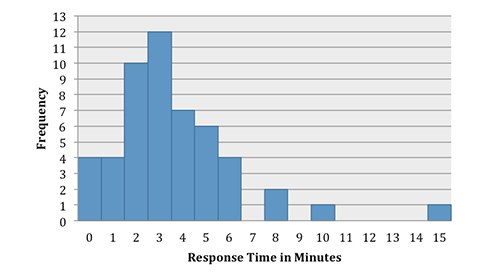
Figure 4 shows police response time for these events. This information was not available for more than half of the cases identified. For the 51 cases that included the data, the median response time was three minutes—fast by law enforcement standards.
Figure 4. Police Response Time
Number Shot
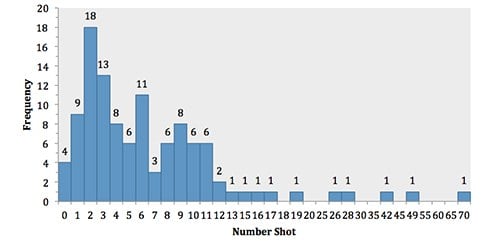
Figure 5 depicts the number of people shot per event—the median is five. It should be noted that if the shooter is shot, the authors do not include the shooter in their counts of the number of people shot or killed. As can be seen in the figure, most of the events are clustered on the left side and do not represent mass casualty situations. However, there are a number of mass casualty situations on the right-hand side of the figure. It also is worth noting that in the five largest-casualty events (Northern Illinois University in DeKalb; Sandy Hook Elementary School; Fort Hood Army Base, Killeen, Texas; Virginia Polytechnic and State University in Blacksburg; and the Century 21 Theater) the police were on scene in about 3 minutes; yet, a substantial number of people still were shot and injured or killed.
Figure 5. Number Shot Per Event
Characteristics of the Shooter
Shooter Profile
Single shooters conducted all attacks between 2000 to 2012 that the authors identified. Shooters did not fit a specific profile. While most (94 percent) of the shooters were male, some were female. They also came from different racial and ethnic categories. The youngest shooter in the data set was 13, and the oldest was 88. Again, no clear profile based upon the demographics of the shooter was observed.
Relationship Between Shooter and Victims
The shooter did not have any apparent connection (such as being a current or former student/employee) with the attack location in 45 percent of events. In 55 percent of the incidents, the shooter did have a connection with the attack location.
Shooter Equipment
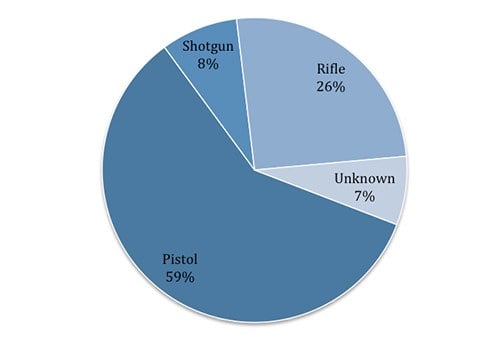
Figure 6 shows the most powerful weapon that shooters brought to the attack site. In about 60 percent of the attacks the most powerful weapon used was a pistol. In 8 percent it was a shotgun, and the most powerful weapon used was a rifle in about 25 percent of the cases. Shooters brought multiple weapons in about one-third of the attacks. Perpetrators brought improvised explosive devices (IEDs) to the attack site in 3 percent of the cases and wore body armor in 5 percent.
Figure 6. Most Powerful Weapon Used
Resolution of the Event
Conclusion of All Incidents
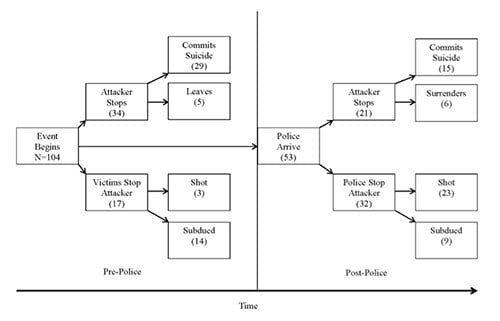
Figure 7 depicts how the attacks ended. Six media accounts for events ending in 2011 and 2012 did not explicitly state how the incidents concluded; therefore, these events were excluded from the flowchart. If the incident ended before law enforcement officers arrived on scene, it is depicted to the left of the centerline. Events that ended after the police arrived are depicted to the right of the centerline. Approximately half of the events (49 percent) ended before law enforcement arrived on scene. This points to the phenomenal speed with which these incidents occur.
Of the cases that ended before the police arrived, 67 percent (34) ended with attackers stopping themselves via suicide (29 cases) or by leaving the scene (5 cases). In the other 33 percent (17) of the cases that ended before the police arrived, the potential victims at the scene stopped the shooter themselves. Most commonly they physically subdued the attacker (14 cases), but three cases involved people at the scene shooting the perpetrator to end the attack.
ASEs still were ongoing when law enforcement arrived in 51 percent (53) of the cases. Of these, attackers stopped themselves when law enforcement arrived in 21 cases (40 percent). Most commonly the attacker committed suicide (15 cases), but there were six cases in which the perpetrator surrendered to the arriving police.
Law enforcement officers used force to stop perpetrators 60 percent of the time (32 cases) when the attack still was ongoing at the time of their arrival. Most commonly they shot the attacker (23 cases). In nine cases responding officers subdued the attacker with means other than a firearm.
In eight (7 percent) of the cases the authors examined, the attacker shot the responding officers. If only the shootings that were active at the time that the police arrived are considered (53—those to the right of the centerline), then officers were shot in 15 percent of events ongoing at the time of their arrival. That makes an active shooter call among the most dangerous in law enforcement.
Figure 7. Event Resolution
Solo Officer Response
Initially, training programs and departments instructed their officers to form teams before entering a structure to seek out an attacker. Teams offer the responding officers a variety of advantages, but they also take time to assemble. As time went by, agencies began to weigh the advantages and disadvantages of smaller teams and even solo officer entry into the attack location. Many departments now authorize officers to make solo entry into locations where an ASE is occurring.
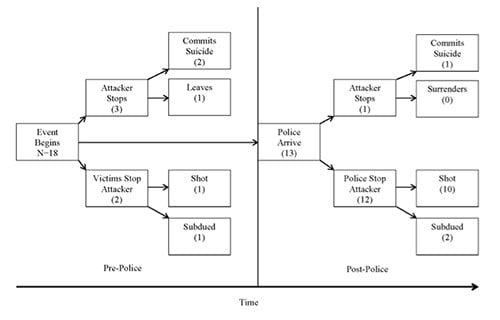
The authors also sought to assess how events that included solo officer entry unfolded. In many cases, solo officer entry was a difficult item to code. Police and media reports often did not contain enough information to determine whether a solo officer entry was conducted; nonetheless, the authors identified 18 cases that they confidently believe involved solo officer entry. The resolution of the cases is presented in figure 8. During solo officer entries, the event likely would be ongoing, and the officers probably would use force to stop the attacker. This most likely was a product of these officers arriving on scene and entering the attack site quickly—the median response time was three minutes for all events and two minutes for those involving solo officers.
In total, 13 of the 18 events (72 percent) still were ongoing when solo officers arrived on scene. Of these 13 incidents, law enforcement personnel either shot or physically subdued the shooter 12 times. Solo officers were also more likely to be injured during the event. Three of the 18 solo officers (17 percent) were shot. If only cases ongoing at the time of solo officer entry (13) were considered, officers were shot 23 percent of the time. Solo officer entries provide faster response, but also increase the danger to the officer.
Figure 8. Event Resolution for Solo Officer Entries
TRAINING AND EQUIPMENT IMPLICATIONS
Prepared to Use Force
The authors have seen discussions on message boards—even in training classes—where officers suggest the only training needed to respond to ASEs is to get to the scene quickly. The belief is that most events will be over, or suspects will kill themselves. While it is true that 1) 49 percent of the events end before officers arrive and 2) suspects kill themselves after the police arrive 14 percent of the time, responding officers used force to stop the attack in 31 percent of the ASEs assessed. This 1 in 3 chance of having to use force makes it clear that simply training officers to show up is not enough. Officers must learn the tactical skills needed to successfully resolve these events. Because not all events occur indoors (18 percent happen outdoors), officers must be trained to operate in both environments. Indoor (i.e., close-quarters) battle tactics are not suitable in outdoor environments, and using them outdoors can be fatal.
Being prepared to use force also means having the equipment needed to act effectively. The data clearly support equipping officers with patrol rifles. Many ASE sites involve open spaces or long hallways that create engagement distances beyond the ability of most officers to effectively engage a suspect with a pistol. Add this to the possibility that the officers may have to place precision fire on a suspect while avoiding hitting fleeing or injured victims, and the need for patrol rifles is clear. Additionally, about a quarter of attackers are armed with rifles. Officers ought to have firepower at least equivalent to what they will face if they go in harm’s way.
Because shooters often carry rifles and frequently shoot at officers in these events, law enforcement personnel should wear body armor that can protect them from rifle fire. This means that officers should be equipped with ballistic plates. Most of the rifle rounds used by active shooters can be stopped with type III plates, but some shooters have fired rounds that would be stopped only by type IV plates. Many of the commercially available plate carriers also have attachment points that can be used to carry other equipment, which proves useful during ASEs. This allows the plate carrier to serve as a “go bag” in addition to providing enhanced protection.
Some agencies recommend the use of ballistic shields in ASEs. The danger inherent in these events argues for increased protection, but that generally comes with a tradeoff. For instance, most shields are designed to be used with pistols, which would require the officer to give up the ballistic advantage of a rifle. Also, man-portable shields currently are not rated to stop rifle fire. In the roughly 1 of 4 events where the shooter is armed with a rifle, a shield would not provide additional protection.
Ready to Provide Medical Assistance
During the confusion of an ASE, it is common for different descriptions of the shooter to be phoned into 911 or communicated to responding officers. This often creates a situation where, even though the police have found the body of or dealt with a shooter directly, they cannot be certain that this was the only shooter. Additionally, it is common for people to continue to call in reports of people with guns after the shooter has been dealt with. In some cases, this is caused by a lag between observation and reporting. The person calling saw the actual shooter, fled, and then reported what he or she saw several minutes later. In others, the caller has seen police officers responding in plain clothes or nontraditional uniforms and mistaken the officers for attackers. In yet other cases, the callers are simply wrong. Regardless of the cause of the confusion, the officers on scene often must engage in a systematic search of the attack location to confirm that there is not another shooter. In a large attack site, this search can take hours.
This creates a problem for those wounded and in need of medical care because most EMS providers will not enter a scene until it is declared “secure” or “cold.” Securing the scene can take hours. During this time, victims may bleed to death or go into shock and die. To combat this problem, national organizations have endorsed the Rescue Task Force (RTF) concept.5 This involves having EMS personnel enter attack sites to stabilize and rapidly remove the injured, while a ballistic or explosive threat still may exist. EMS personnel operating in RTFs wear body armor and are provided security by law enforcement personnel. This concept represents a significant improvement in EMS response to ASEs, but it undoubtedly will take substantial time to implement nationwide.
Even with faster EMS response, responding officers will face situations where they can save the lives of victims by quickly applying proper hemorrhage control techniques after the immediate threat has been dealt with. Additionally, in a mass-casualty event, the number of wounded may overwhelm the capabilities of responding EMS personnel. Recognizing that the primary objective of a responding officer is to neutralize the threat, if officers have some medical training, they may be in a position to aid the injured and possibly save lives.6 This training currently is available, and the authors strongly recommend that all law enforcement officers receive it to maximize their ability to help those injured during these horrible events.7
Obviously, if officers are going to be trained to provide medical aid, they need equipment to provide this aid. Numerous wound care kits are commercially available and easily can be attached to a plate carrier. Also, the authors suggest that all officers carry tourniquets. Tourniquets are useful for stopping extremity bleeding, whether it is caused by a gunshot wound or other trauma. In numerous cases across the country, officers have saved not only the lives of other officers but also civilians by applying a tourniquet.
Civilians Trained to React
Police have, generally, done an excellent job responding to active shooter events quickly. Despite the dramatic improvement in police response since the Columbine High School shooting incident, attacks that result in high numbers of casualties continue. The five highest casualty events since 2000 happened despite police arriving on scene in about three minutes. Clearly, fast and effective police response comprises only part of the answer to limiting the damage done during these attacks.
Also important are the actions that civilians take to protect themselves during the three or more minutes that it takes the police to arrive. Civilians need to be trained about what to do if one of these attacks occurs. A variety of resources are available at no cost. Federal agencies, including both the FBI and the Department of Homeland Security, Federal Emergency Management Agency, endorse the use of the teaching technique of Run, Hide, Fight to explain to civilians how they can protect themselves and others around them.8 Police departments and the communities they serve should work together to implement this training.
CONCLUSION
The frequency of active shooter events has increased in recent years. These incidents also have generated a substantial amount of public concern. The authors hope that the data provided in this article will provide police administrators with the information they need to form sound, evidence-based best practices in responding to these events and that these best practices will help save lives.
Endnotes
1 J.P. Blair, T. Nichols, D. Burns, and J.R. Curnutt, Active Shooter Events and Response (Boca Raton, FL: CRC Press, 2013).
2 Federal Bureau of Investigation, Critical Incident Response Group, “Active Shooter/Mass Casualty Events,” http://www.fbi.gov/about-us/cirg/active-shooter-and-mass-casualty-incidents (accessed November 22, 2013).
3 Federal Bureau of Investigation, Critical Incident Response Group, “Active Shooter Event: Quick Reference Guide,” http://www.fbi.gov/about-us/cirg/active-shooter-and-mass-casualty-incidents/active-shooter-tent-card-090513.pdf (accessed November 22, 2013).
4 Ibid.
5 Department of Homeland Security, Federal Emergency Management Agency, U.S. Fire Administration, “Fire/Emergency Medical Services Department Operational Considerations and Guide for Active Shooter and Mass Casualty Incidents,” http://www.usfa.fema.gov/downloads/
pdf/publications/active_shooter_guide.pdf (accessed November 26, 2013); International Association of Fire Fighters, “IAFF Position Statement: Active Shooter Events,” http://www.iaff.org/Comm/PDFs/IAFF_Active_Shooter_Position_Statement.pdf (accessed November 26, 2013); Joint Committee to Create a National Policy to Enhance Survivability From Mass Casualty Shooting Events, “Improving Survival from Active Shooter Events: The Hartford Consensus,” http://www.naemt.org/Libraries/Trauma%20Resources/
Hartford%20Consensus%20Document%20Final%204-8-13.sflb (accessed November 26, 2013); Joint Committee to Create a National Policy to Enhance Survivability From Mass Casualty Shooting Events, “Active Shooter and Intentional Mass-Casualty Events: The Hartford Consensus II,” http://bulletin.facs.org/2013/09/hartford-consensus-ii/ (accessed November 26, 2013); and Joint Committee to Create a National Policy to Enhance Survivability From Mass Casualty Shooting Events, “Improving Survival from Active Shooter Events: The Hartford Consensus,” http://bulletin.facs.org/2013/06/improving-survival-from-active-shooter-events/ (accessed November 26, 2013).
6 Joint Committee to Create a National Policy to Enhance Survivability From Mass Casualty Shooting Events, “Improving Survival from Active Shooter Events: The Hartford Consensus.”
7 For additional information, see the standards developed by the Committee for Tactical Emergency Casualty Care at c-tecc.org (accessed November 26, 2013).
8 Federal Bureau of Investigation, Critical Incident Response Group, “Active Shooter/Mass Casualty Events”; and Ready Houston, http://www.readyhoustontx.gov/videos.html#rhf (accessed November 26, 2013).