
Crime Data
National Use-of-Force Data Collection Statistics for 2021

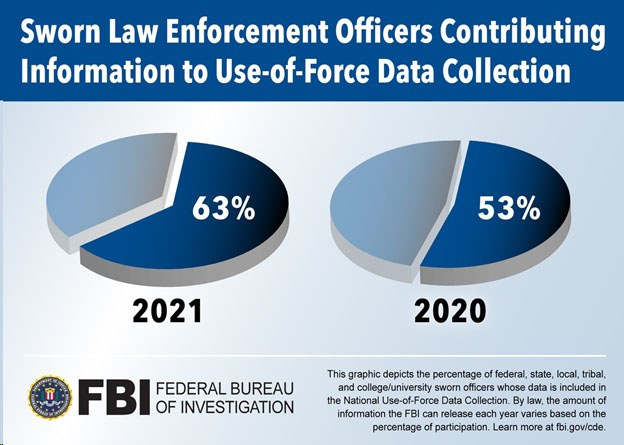
In 2021, 8,226 law enforcement agencies submitted use-of-force data to the National Use-of-Force Data Collection, managed by the FBI’s Uniform Crime Reporting (UCR) Program. These agencies represent 63% of all federal, state, local, tribal, and college/university sworn officers.1
The data reported to the FBI for the first quarter of 2022 is also available. From January to March 2022, 6,775 law enforcement agencies — representing 53% of all federal, state, local, tribal, and college/university sworn officers — sent use-of-force data to the National Use-of-Force Data Collection. Because agencies provided data representing more than 40% of the nation’s officers but not more than 60%, only participation data was released for this period.
This data can be accessed on the FBI’s Crime Data Explorer at https://crime-data-explorer.app.cloud.gov/pages/le/uof.
Data Summary
For 2021, the FBI released national-level data based on a threshold of 60% participation by federal, state, local, tribal, and college/university sworn officers. At this level of participation, the FBI releases data as ratios and percentages in terms of the most frequently reported responses to questions (in list format without actual counts).
Agencies submitted data concerning qualifying uses of force that included any action resulting in the death or serious bodily injury2 of a person or the discharge of a firearm at or in the direction of a person. If no qualifying incidents occurred, agencies submitted a zero report for that month. This data includes those agencies that submitted at least one incident or zero report for 2021.
Due to rounding, percentage totals may not equal 100%.
Type of Incident
In 2021, 50.2% of use-of-force incidents submitted to the FBI resulted in serious bodily injury of a person, 33.5% caused the death of a person, and 17.2% involved the discharge of a firearm at or in the direction of a person.
Reason for Initial Contact
Most-reported reasons for initial contact:
- 56.7% involved officers responding to unlawful or suspicious activities.
- 11.2% stemmed from traffic stops.
- 10.1% resulted from warrant services/court orders.
- 7.8% were for medical, mental health, or welfare checks on individuals.
- 3.2% followed routine patrols other than traffic stops.
- 2.1% involved follow-up investigations.
- 7% were unknown and unlikely to ever be known.
Type of Force Applied
Most-often used types of force:
- Firearms
- Hands, fists, or feet
- Electronic control devices
- Canines
- Other
Form of Resistance Encountered
In use-of-force incidents, officers most often encountered individuals who failed to comply with verbal commands or exhibited other types of passive resistance. Additional forms of resistance encountered included displaying a weapon to an officer or another individual, attempting to escape or flee custody, using a firearm against an officer or another person, or resisting handcuffing or arrest.
Privacy Measures
To protect the privacy of individuals involved in these use-of-force incidents, regional and state levels of analysis are not available with data that represents 60% participation. Datasets at the regional and state level contain smaller numbers of reported incidents and less variety within the data elements. These variables increase the risk of linking specific answers in the data to individuals involved in such incidents. The UCR Program is working diligently to develop new ways to maximize data transparency while fulfilling its responsibility to protect the privacy of all individuals.
Participation
The level of participation in the National Use-of-Force Data Collection, which began on January 1, 2019, is expected to continue to grow as more agencies become aware of this opportunity. When the percentage of officers represented in the data collection reaches 80% or greater, the FBI may present aggregated use-of-force data.
Submitted by Tara A. Perine, writer-editor in the FBI’s Criminal Justice Information Services Division.
Endnotes
1 The FBI uses a total count of 860,000 sworn police employees, an estimate by the UCR Program, based on all known and reasonably presumed federal, state, local, tribal, and college/university sworn law enforcement personnel eligible to participate in the National Use-of-Force Data Collection.
2 For the purpose of this data collection, the definition of serious bodily injury is based, in part, on 18 U.S.C. § 2246 (4): The term “‘serious bodily injury’ means bodily injury that involves a substantial risk of death, unconsciousness, extreme physical pain, protracted and obvious disfigurement, or protracted loss or impairment of the function of a bodily member, organ, or mental faculty.”